Analyzing Occupations of Movie Protagonists From 100 Years of Film
2026-07-13
I’ve been on an old movies kick lately and was really taken by how often journalists were main characters in older movies. Journalism has always seemed appealing to me career-wise, so it makes sense, but it really made me notice how stark the difference was between how often journalists were present in movies then compared to now - His Girl Friday, The Philadelphia Story, Roman Holiday, and of course, our all-American hero: Clark Kent, AKA Superman. It’s a sexy occupation, of course, but what happened? All the President’s Men revives the sexy, dashing journalist archetype somewhat, but something in between happened to take the charm out of journalism which I can’t quite clock.
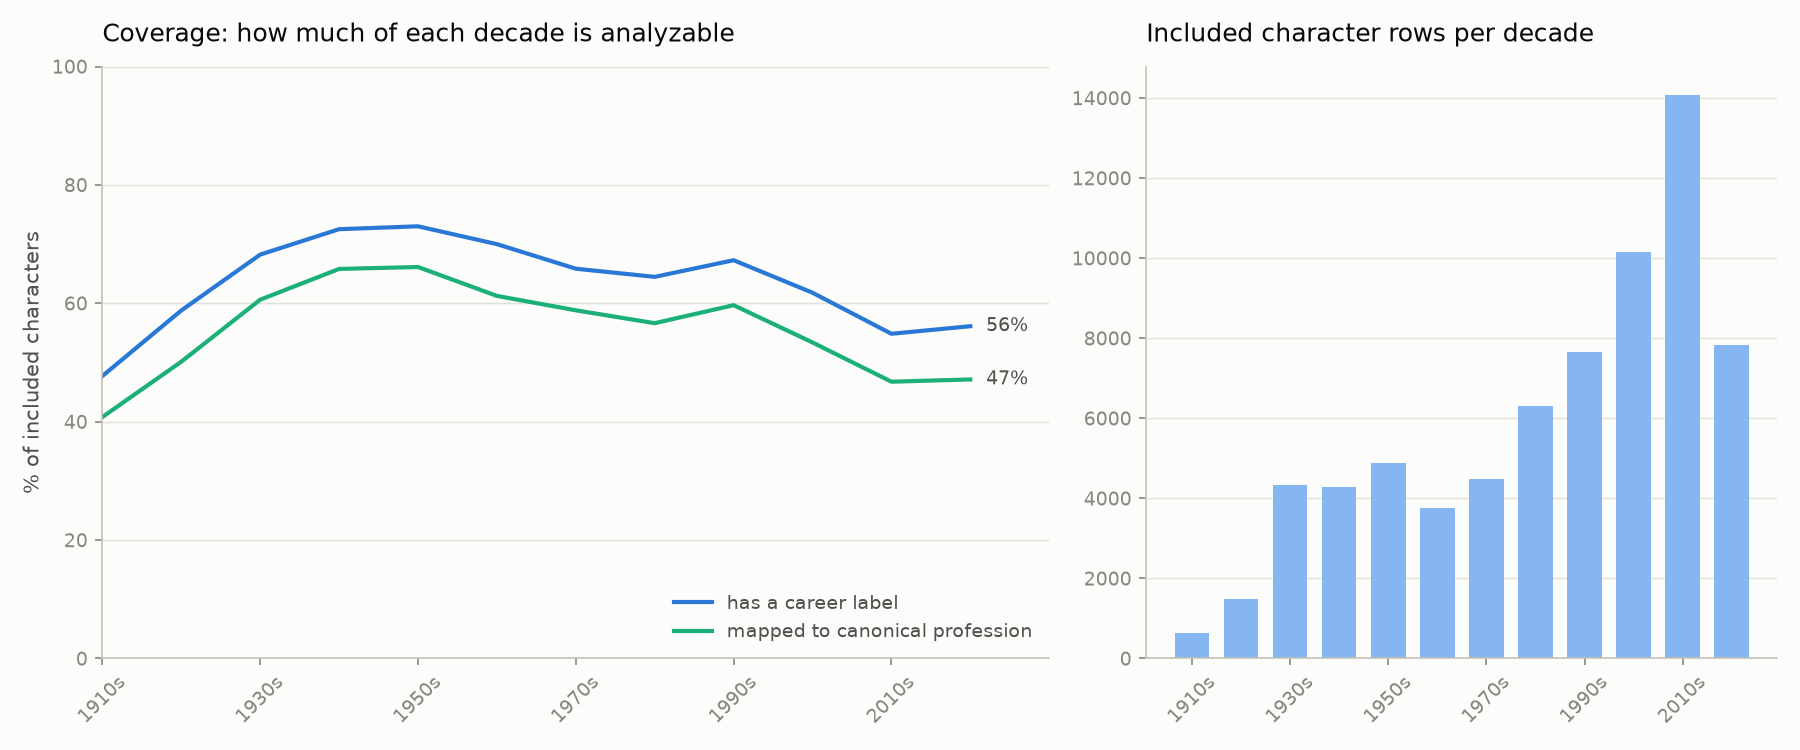
This led me down the rabbit hole of wanting to know when and where and maybe why the drop happened. I used IMDb’s movie database, took the top 20% of movies from each year, and used LLMs to try to extract the occupations of the top 3 billed characters to see if I could determine this. More details about the actual process are here, which I wrote up because it was my first time working on a project like this and if someone has a better way to do it I would definitely appreciate any constructive criticism (or spiteful cynicism). If anyone has any suggestions on a better way to look at this data, I would appreciate that a lot as well :)
Some of the things I noticed detailed below! You can also view the interactive dashboard here. Hope you enjoy :)
Journalists
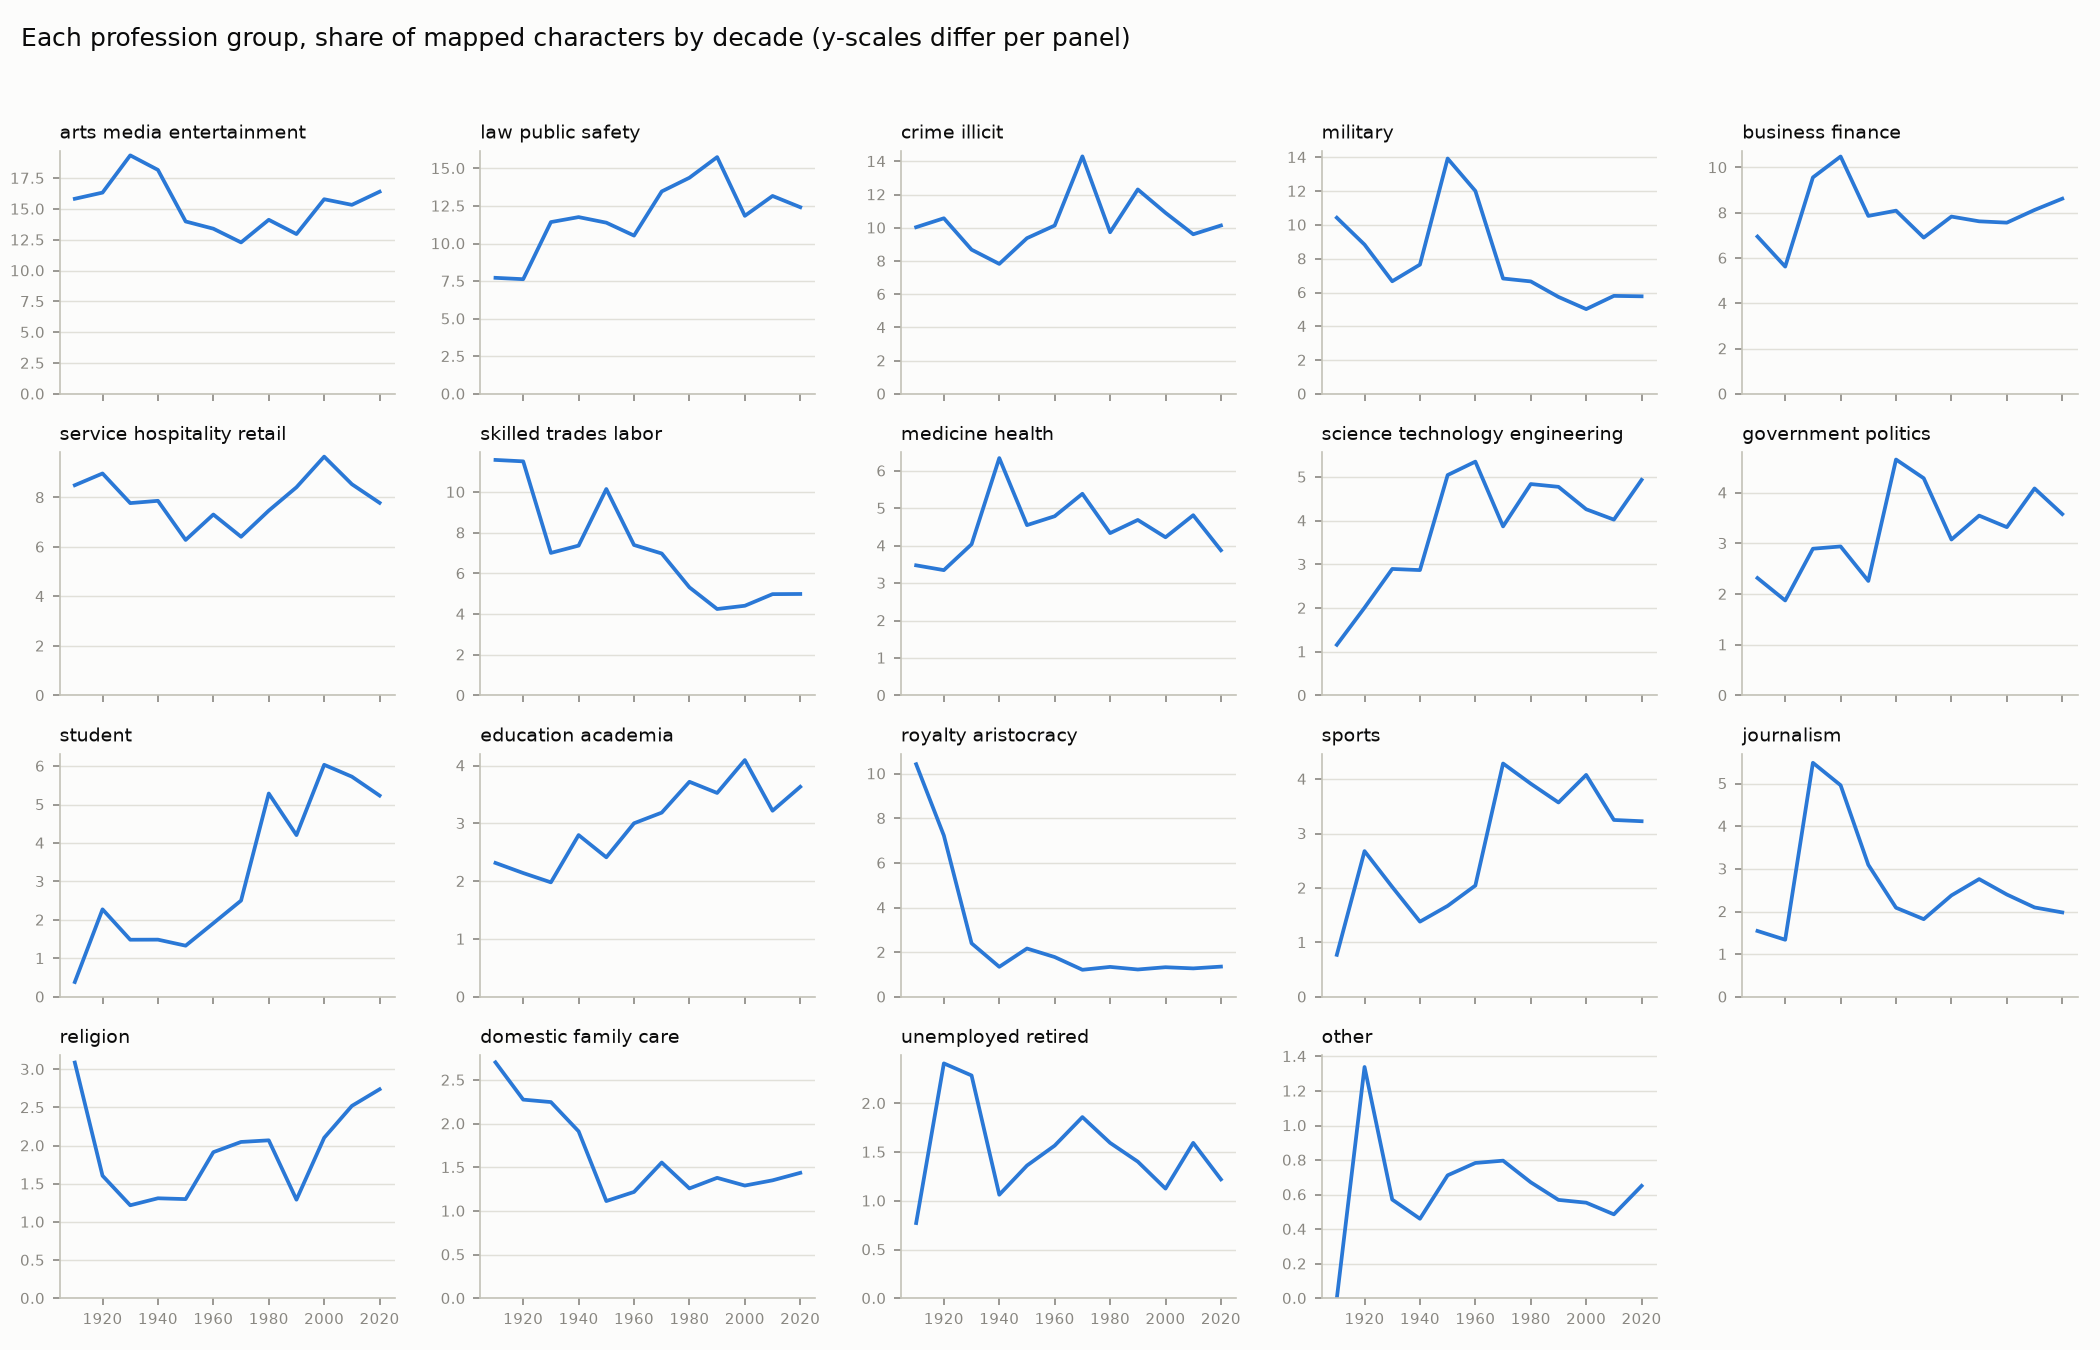
The decline I noticed is visible in the charts - in the 30s and 40s there’s a crazy spike (over twice as many journalists in movies then compared to the decades after). The Superman comics also came out in the late 30s, if there's any relationship there. There are likely just a lot of different reasons that converge on this, instead of the one main reason I’d like to have. I can take the satisfaction of being proved correct regarding the overall pattern, though.
Gender
Maybe intuitive for the most part, but the numbers admittedly surprised me more than I thought. There were more male main characters than female main characters, of course, but only 41.9% of the female main characters were mapped to a true profession, with 65% of male main characters mapped to professions. There seems to have been an increase in both female main characters and female main characters with jobs over the last few decades. (There also seemed to be a continuous decrease during the Hays Code era).
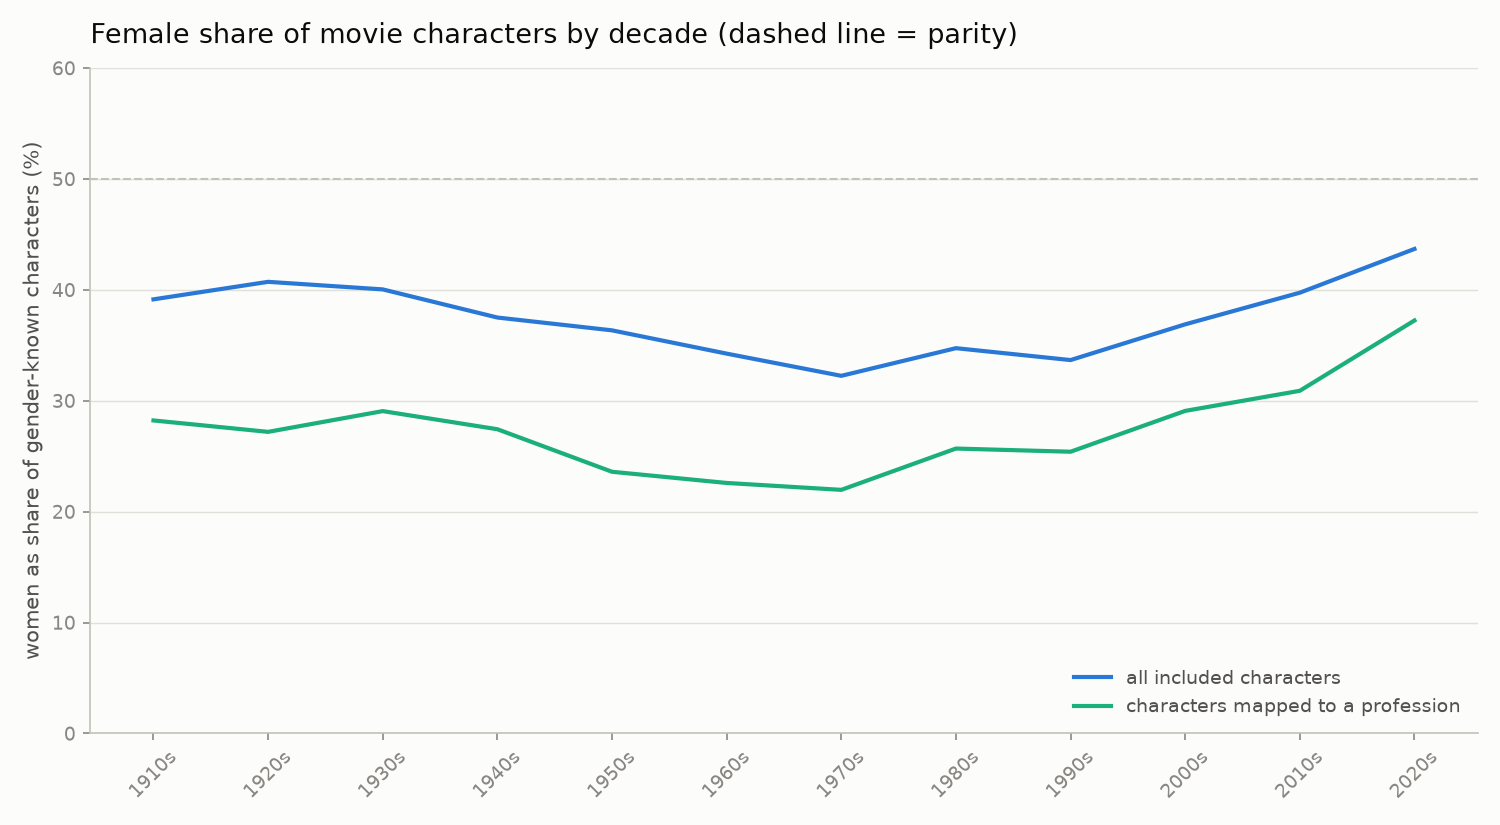
One other thing that really struck me was the professions these women were - the 8th most common career for a woman main character was some form of prostitute. This likely would have been much higher if not for the significant drop during the Hays Code era; in the early 70s, almost 10% of female main characters with professions were prostitutes.
Other Patterns of Note That Mostly Explain Themselves
- In the 1950s and 60s there’s a clear spike in characters in military professions. Decline after that is pretty constant before plateauing in the 2000s until now.
- Increase in students over time - cheaper to watch movies now? Target audience getting younger, I assume
- Decline in skilled trades/labor - economy less reliant on these?
- Pretty significant increase in sports over time - with television, etc., likely just stronger celebrity culture around athletes
- Arts/media/entertainment dominance - same reason main characters in fiction are often writers
- Non-profession roles for women are often just family roles (mother, daughter, etc), but men’s non-profession roles are a lot more interesting and varied (Santa Claus, God, wizard)
I’m certain there are a lot more nuanced explanations for a lot of these things, and if anyone has any thoughts, I’d be thrilled to hear them.
This project is obviously a very rough approximation of an answer to the broader questions, all things considered; I do believe the patterns are broadly accurate, though. If anything strikes you as particularly egregious, or if you have any notes/other thoughts, please reach out and email me!